- Home
- Technical Products
High-Performance Data and Automation
ADAS Simulation and Testing Framework
In-Vehicle Network Communications
Industrial Internet of Things and Digital Factories
AI Machine Vision
Pharmaceutical Cold Chain and Environmental Monitoring
Laboratory Automation and Microfluidics
Environmental Monitoring and Facility Management
Critical Infrastructure Communications and Remote Collaboration
Professional Electronic Testing and Measurement
- Solutions
High-Performance Data and Automation
ADAS Simulation and Testing Framework
In-Vehicle Network Communications
Industrial Internet of Things and Digital Factories
AI Machine Vision
Pharmaceutical Cold Chain and Environmental Monitoring
Laboratory Automation and Microfluidics
Environmental Monitoring and Facility Management
Critical Infrastructure Communications and Remote Collaboration
- Latest Case Studies
- About Us
EN
Ethernet Testing · Software Licensing Applications
Online Data Acquisition and Protocol Analyzer
INLINE CAPTURE AND PROTOCOL ANALYZER
Real-time network traffic monitoring enables rapid identification of complex network issues. It provides R&D, testing, and technical support engineers with comprehensive visualization capabilities ranging from packet capture and protocol analysis to latency monitoring.
- Transparent chaining, or access via TAP/SPAN bypass
- L1 PCS Bits and L2+ Packet Line-Rate Capture
- Custom Filters and Triggers for Tracking Intermittent Faults
LIVE TRAFFIC VISIBILITY
CAPTURE • ANALYZE • MONITOR
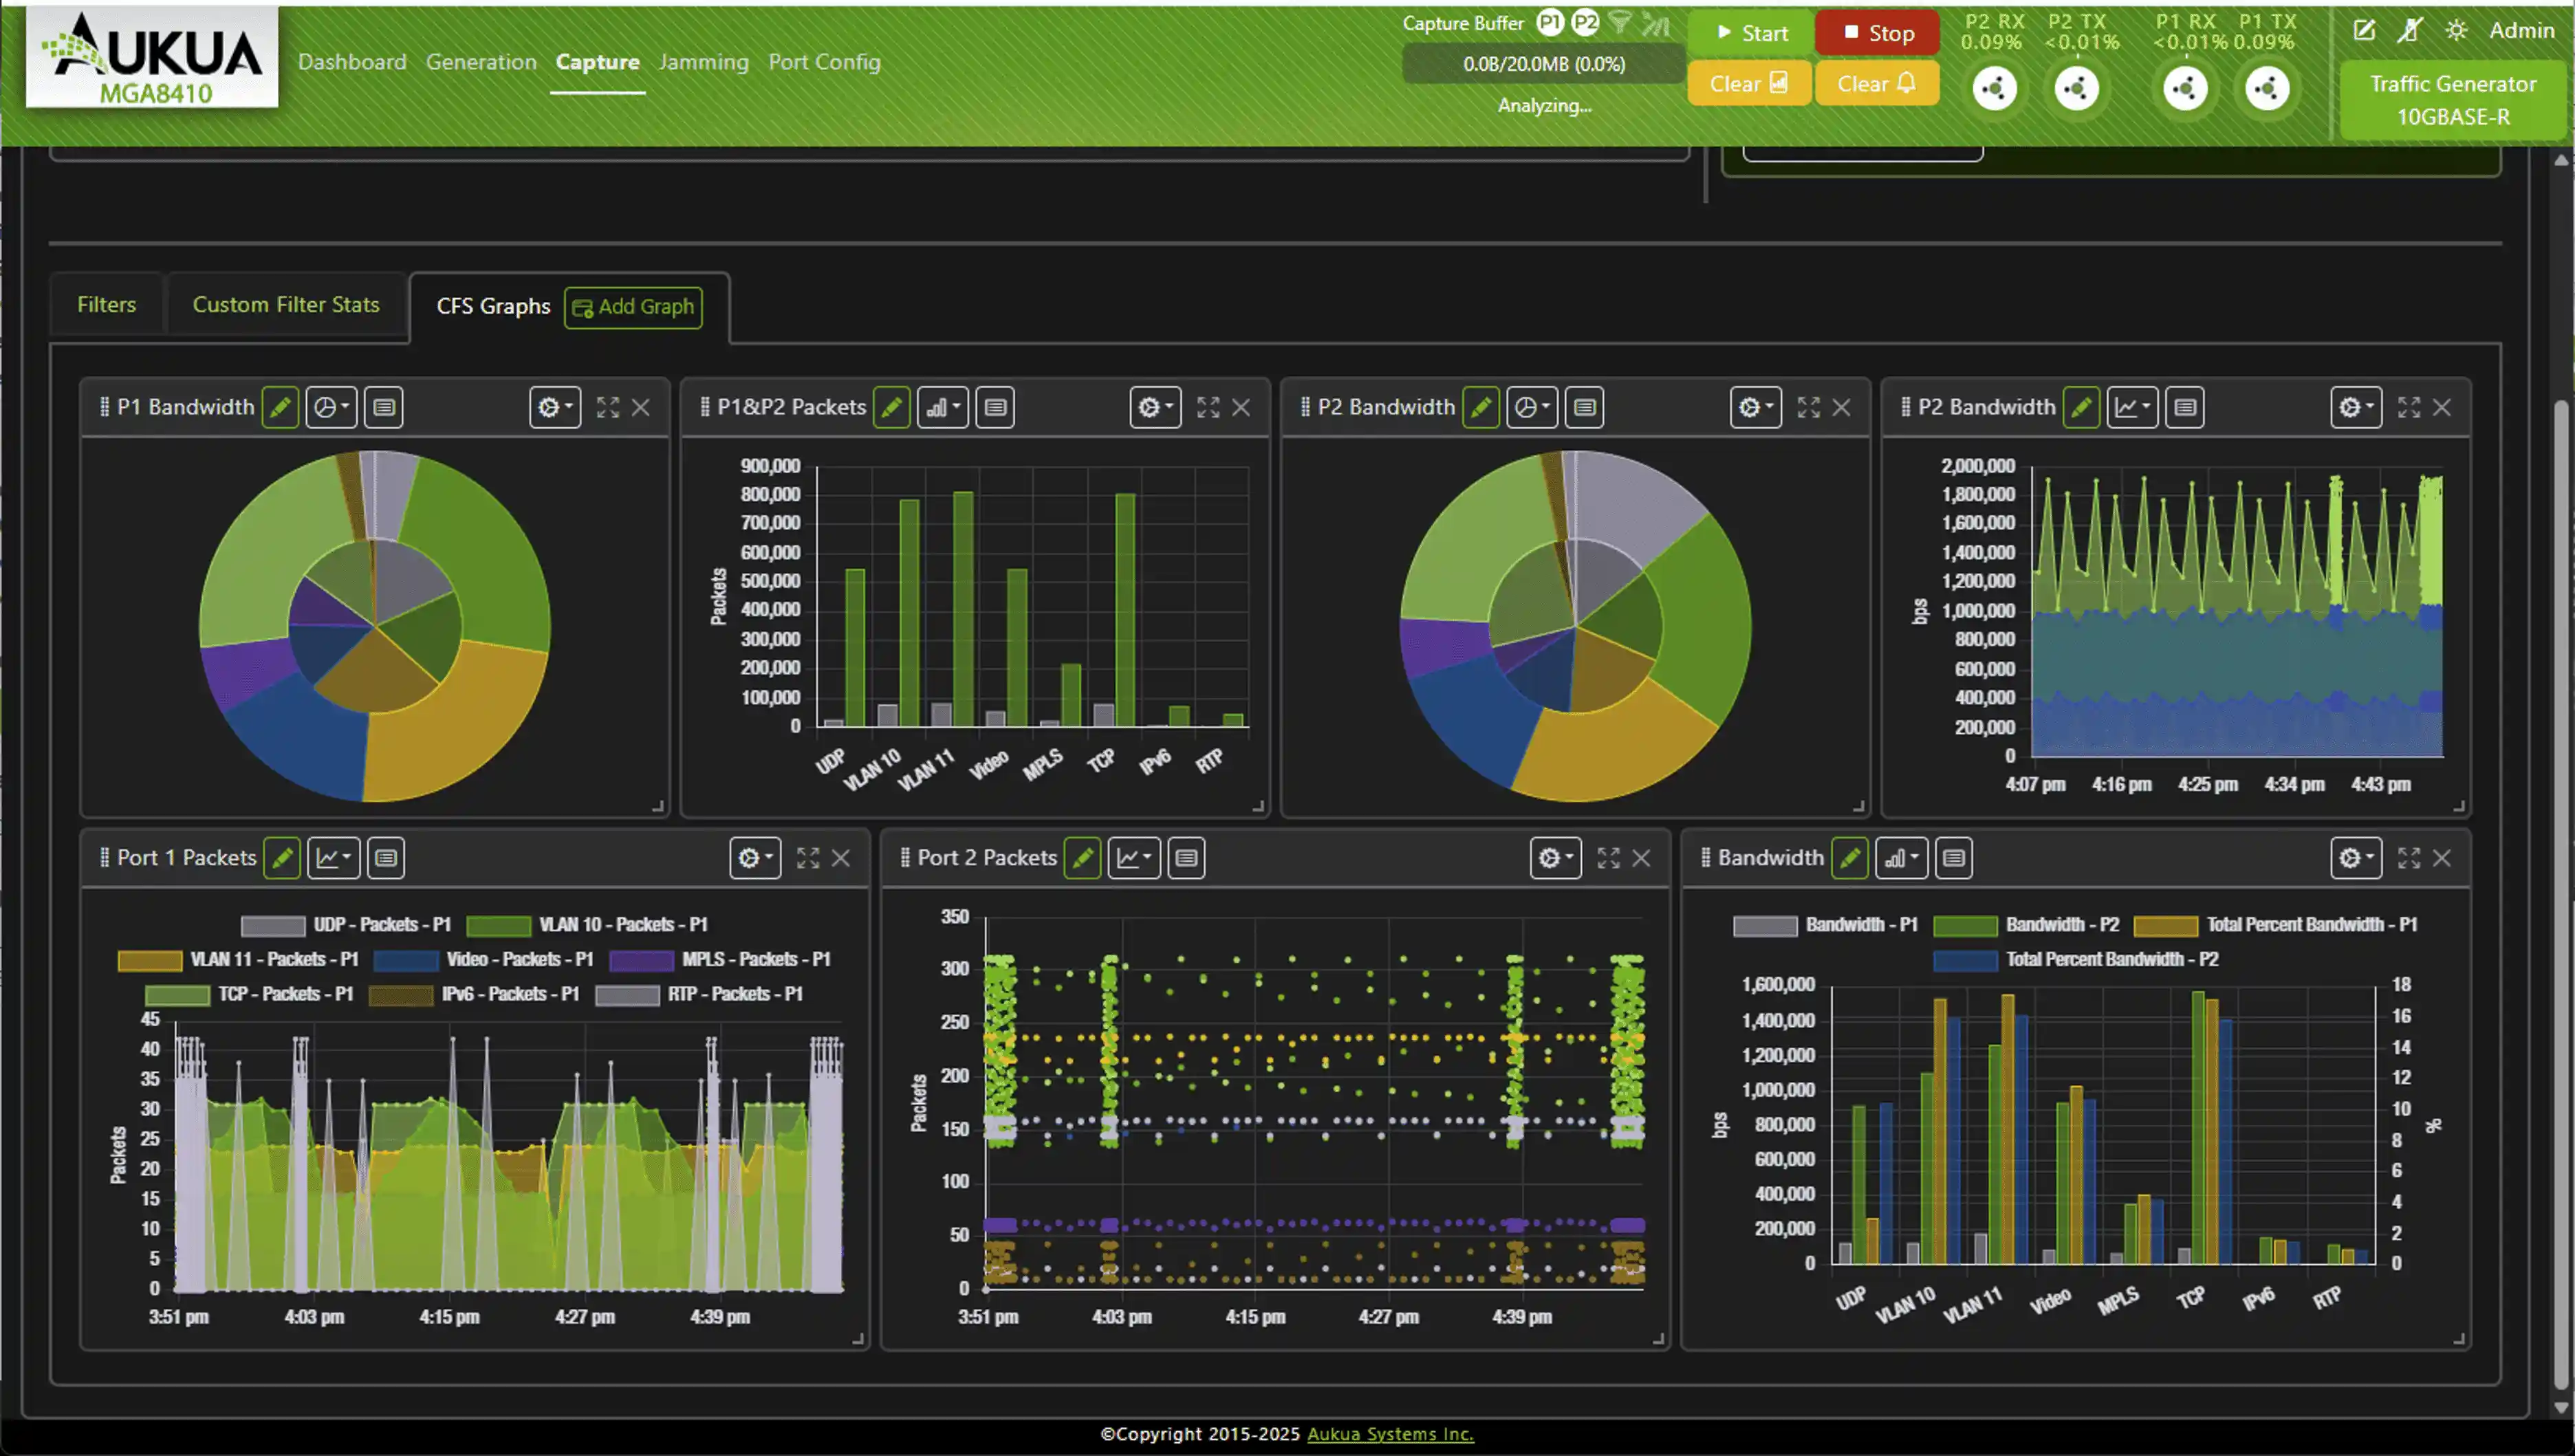
MGA8410 User Interface Example
REAL-TIME ETHERNET VISIBILITY
Identifying Clues to Problems in Real Traffic
When endpoint logs are insufficient to explain network anomalies, directly observing packets, protocols, errors, and latency on the link provides direct evidence for verification and troubleshooting.
01
Link Extraction Behavior
Low-latency transparent pass-through that captures packets and PCS-layer data traveling along the network path to observe bidirectional communication.
02
Analysis of Protocols and Errors
Supports decoding hundreds of protocols, inspects behavior at the MAC and PCS layers, and identifies abnormal packets and errors.
03
Monitoring Latency and Throughput
Monitor the throughput of real-world application traffic in real time, accurately measure one-way latency, and gain a comprehensive understanding of changes in network performance.
04
Tracking Intermittent Faults
Trigger captures based on specific events or packet content, and use custom filters to identify hard-to-replicate vulnerabilities.
INLINE & OUT-OF-BAND CAPTURE
Two connection methods to suit different testing environments
Based on the link access conditions and the monitoring targets, choose either in-line analysis or bypass monitoring.
Transparent Chaining · Observing Traffic Paths
Connect the analyzer in series between the devices under test to capture link traffic in both directions. The low-latency, non-resynchronized transparent transmission mode helps observe real-world network behavior.
Bypass Connection · Flexible Monitoring
Capture and analyze traffic outside the service forwarding path by connecting via a TAP or a switch SPAN port.
The visible traffic captured via a bypass depends on the TAP/SPAN output and settings; please refer to the selected hardware platform for specific connection methods, interface modules, and pass-through functionality.
INTERFACES & PERFORMANCE
Preserving key details from the physical layer to the protocol layer
With line-rate capture, precise timestamping, and support for multiple interfaces, it meets the requirements for Ethernet verification and troubleshooting tasks.
The following describes the capabilities available on different platforms; they do not represent the full set of standard features for any specific model. In-vehicle interfaces, data rates, and module support should be confirmed based on the specific platform; “1 ns” refers to timestamp accuracy and does not indicate the delay in serial forwarding.
- 100% line-rate L1 bit/PCS layer capture, as well as L2+ packet/MAC layer capture and protocol analysis.
- Timestamps with 1 ns precision, supporting views such as absolute time and packet interval.
- High-capacity hardware capture cache; improves the efficiency of capturing target events through filtering, packet slicing, and pre- and post-trigger cache allocation.
- Low-latency, non-resynchronized transparent transmission mode; specific applicable interfaces and modes are determined based on the configuration.
- 25GBASE-SR / LR / CR, 10GBASE-R.
- 10GBASE-T, 5GBASE-T, 2.5GBASE-T.
- 5000BASE-R, 2500BASE-R; 5000BASE-X, 2500BASE-X, 1000BASE-X, 100BASE-FX.
- 1000BASE-T, 100BASE-TX, 10BASE-T; USXGMII, SGMII.
- The MGA8410 supports 10MbE–10GbE; the XGA4250 supports 1GbE–25GbE. For low-speed interface requirements, please verify by checking the module settings.
- MGA8410: Supports 100/1000BASE-T1, 2.5G/5G/10GBASE-T1, and optical BASE-RH environments; interface modules must be compatible.
- MGA8410: Supports EEE (IEEE 802.3az) and IEEE 802.3br MAC frame preemption.
- XGA4250: The application brief lists support for IEEE 802.1Qbu / IEEE 802.3br MAC frame preemption.
- When testing in-vehicle Ethernet, please prioritize selecting the MGA8410 based on its interface settings.
- Supports decoding of hundreds of protocols and provides binary, hexadecimal, and protocol views.
- Analyze bandwidth and traffic by dimensions such as protocol, CoS, address, and port.
- Review MAC/PCS layer error statistics and use real-time statistics, alerts, and timestamps to pinpoint the source of events.
FILTER • TRIGGER • AUTOMATE
Analyze in the browser; automate in the test process
No client software installation is required. Use the intuitive interface to capture, filter, generate statistics, and view protocols; you can also integrate repetitive testing workflows via a RESTful API.
Filtering and Triggering
- Custom Extraction Filters and Display Filters
- Trigger capture based on events or packet content
- Preserve the key communication processes before and after the trigger
Traffic and Protocol Analysis
- Analyze traffic by protocol, CoS, address, and port
- View Protocol Decoding and MAC/PCS Errors
- Measuring the one-way delay of actual application packets
Operations and Automation
- Browser-based user interface
- Real-time Statistics, Alerts, and Custom Dashboards
- Automating RESTful API Integration Workflows
MGA8410 User Interface Example
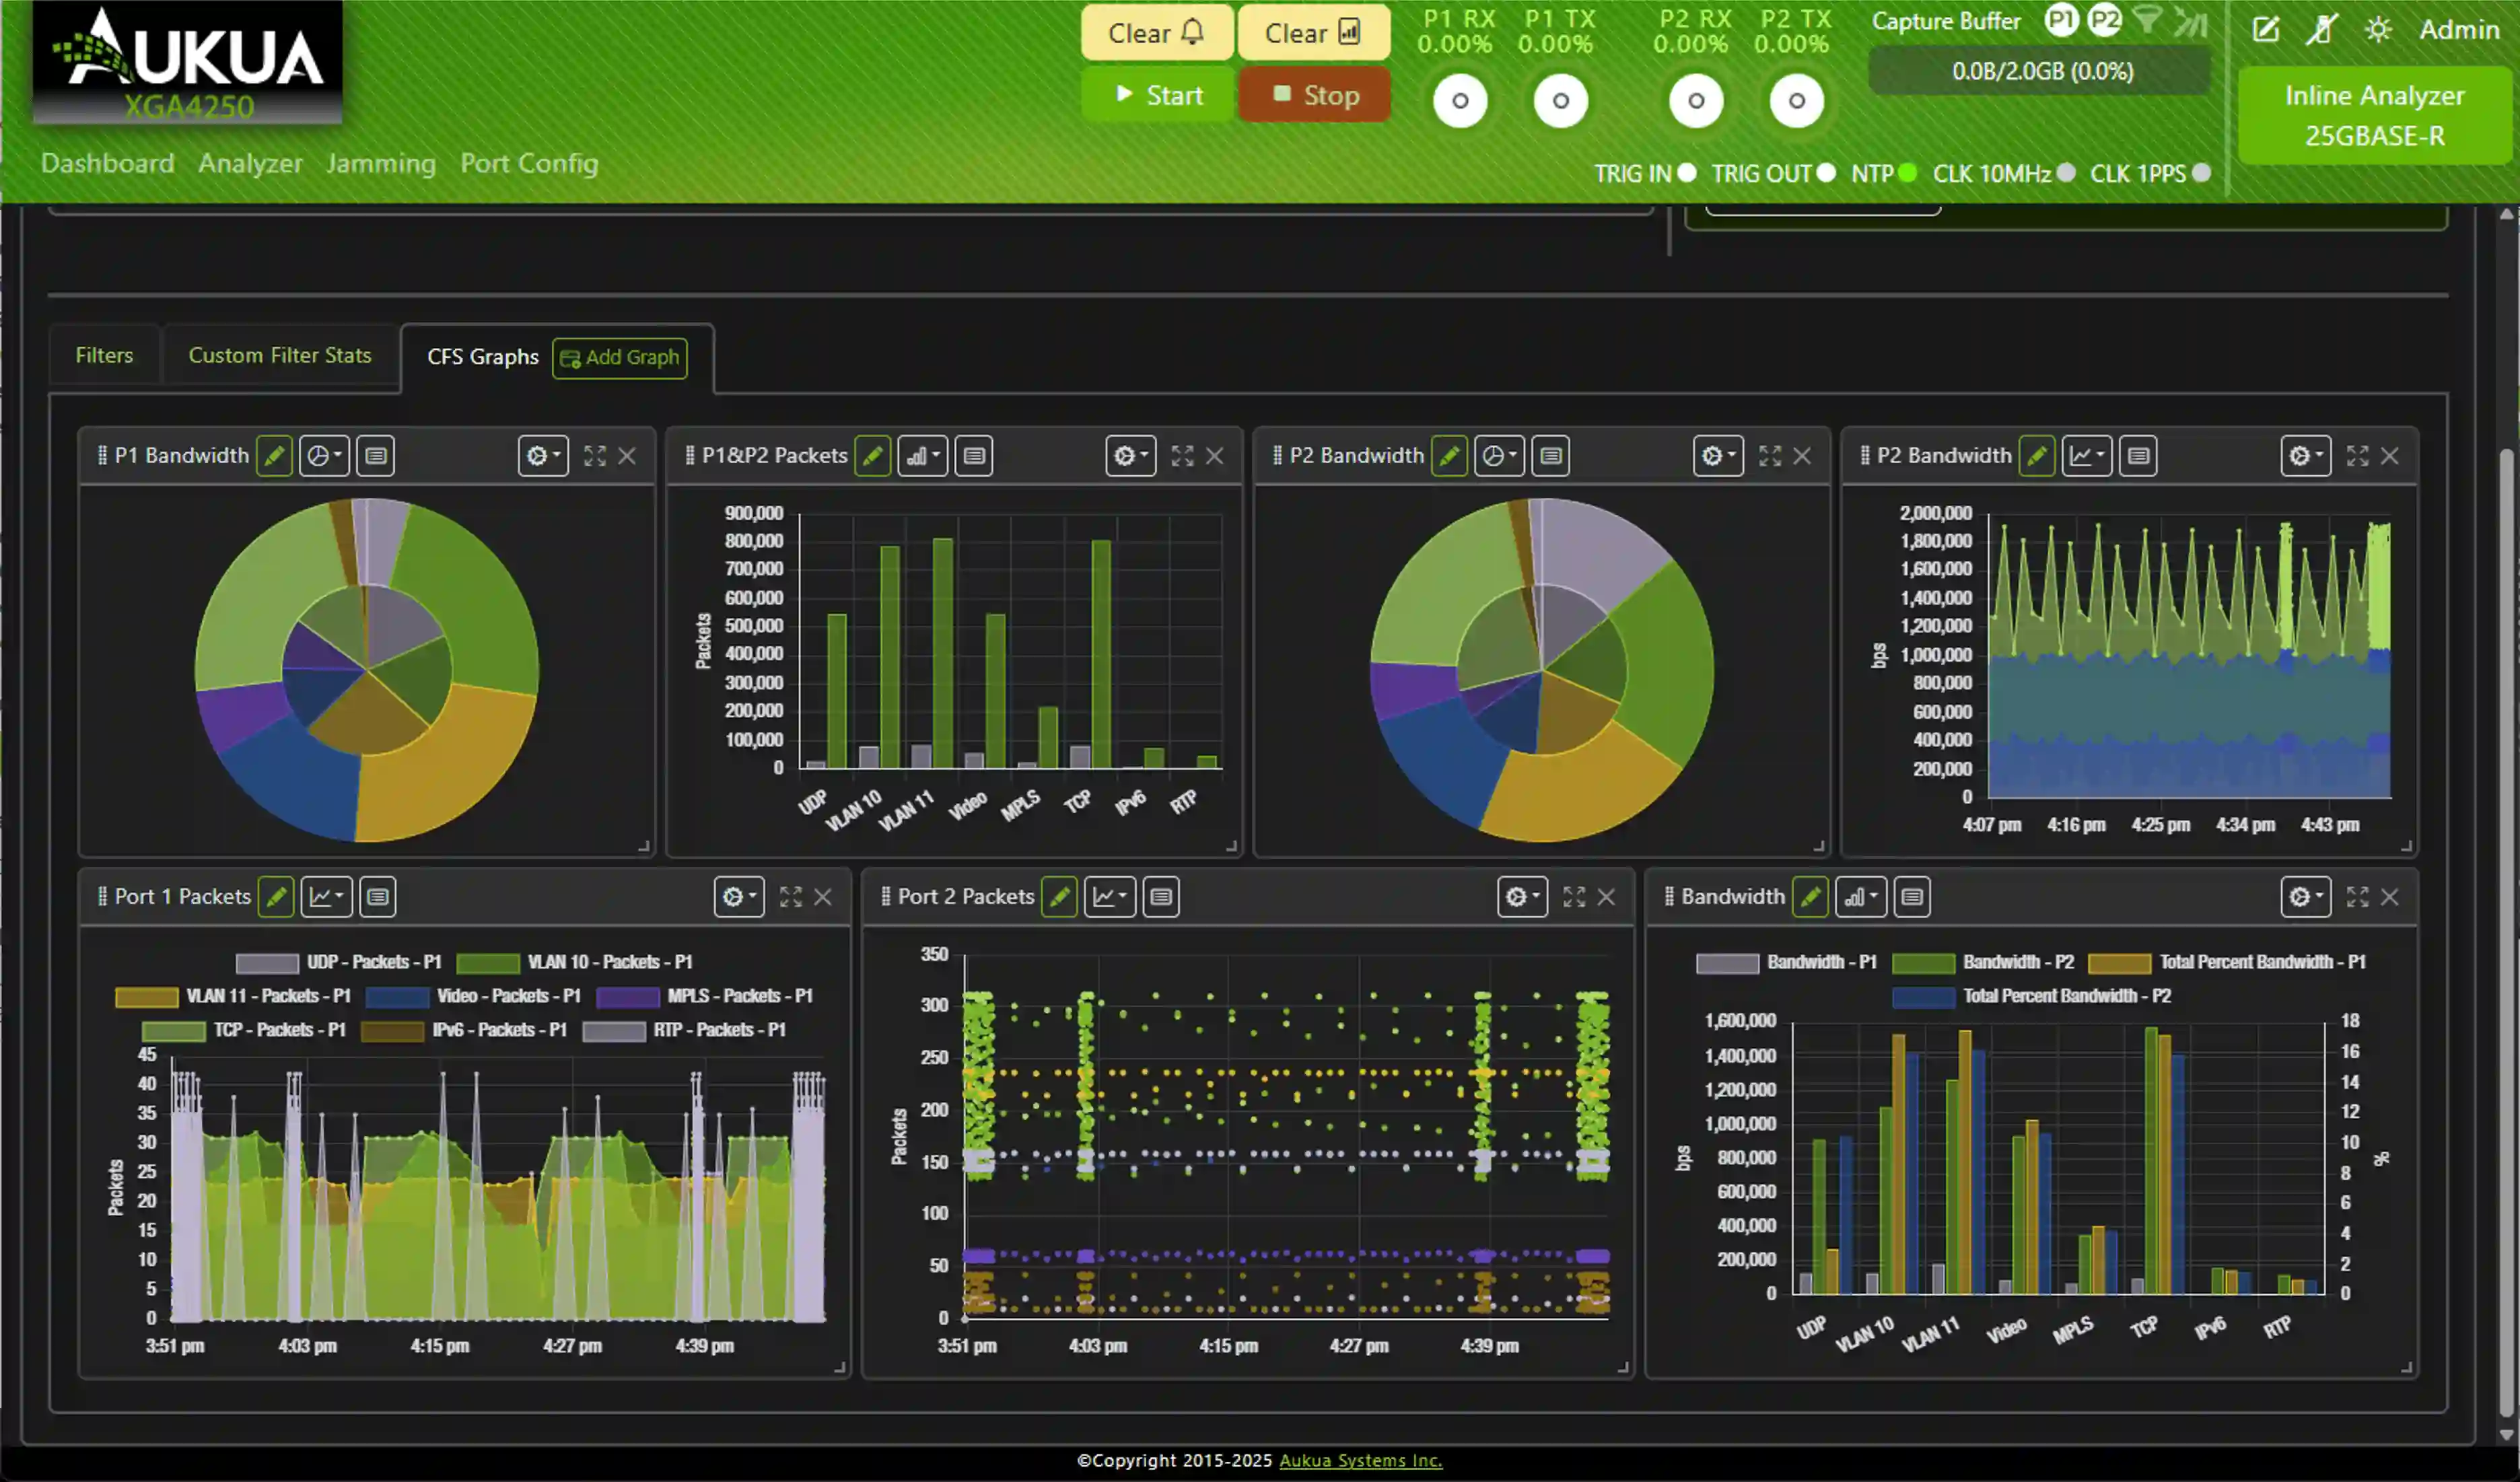
XGA4250 User Interface Example
AVAILABLE HARDWARE PLATFORMS
Select a carrier platform based on link requirements
This application runs on a hardware test platform and is used under the appropriate application license. Configuration settings include the target rate, interface, and test task selection.
MGA8410
Analysis of Multi-Rate Ethernet and In-Vehicle Ethernet
- 10MbE–10GbE Ethernet Environment
- Covers BASE-T1 / BASE-RH In-Vehicle Interface Requirements
- Suitable for multi-interface verification and online fault localization
XGA4250
For online capture and analysis at higher data rates
- 1GbE–25GbE, including 2.5G and 5G speeds
- Analysis of High-Speed Ethernet Links and Protocols
- Suitable for R&D validation, performance monitoring, and troubleshooting
Interface modules, accessories, and application licenses are configured on a per-item basis. If you need to analyze a 10M/100M link on the XGA4250, please contact Hongke to confirm the appropriate interface and module settings. [cite: 14]
HONGKE TECHNICAL SUPPORT
From Test Requirements to Actionable Validation Plans
Hongke provides professional technical consulting, scenario-based solution design, and proof-of-concept (PoC) support.
01 / Professional Technical Consulting
Identify the link speed, interface type, symptoms of the problem, and the events you want to capture.
02 / Scenario-Based Solution Design
In conjunction with the system under test, plan for serial or bypass connections, interface modules, and application licenses.
03 / Proof-of-Concept Support
Discuss the trigger conditions, scope of data capture, and methods for evaluating results, focusing on key use cases.
Professional technical support from HONGKEI to help you succeed in your project.
Leveraging decades of technical expertise in automotive electronics, industrial automation, data security, and life sciences, Hongke provides customers with end-to-end solutions ranging from critical components and precision instruments to system-level platforms. We do more than just supply products; we are committed to helping our customers achieve long-term success through professional technical consulting and innovative optimization.